Back in March, I wrote that I was expecting a 10-20% correction during the summer. In that post, I described how I saw a George Lindsay technical pattern called the Ascending Middle Section playing out on the Dow. I first learned about Middle Sections on Carl Futia’s blog in 2009. He identified a pattern that occurred during 2005-2008.
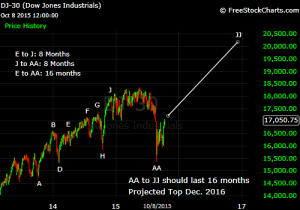
Here is a current chart of the Dow with my Middle Section count. Click the charts for a clearer image.
In March, I decided to label December 2014 as Point J. Even though the market crept to new highs in the spring, the market acted like it was in a correction rather than an impulse, so I consider December to be the “fundamental” top of the uptrend.
The Middle Section predicted that the time from Point J to Point AA would equal the time from Point E (Apr. 2014) to Point J. That relationship worked perfectly in this instance; both E-J and J-AA were 8 months! Given the strong rally over the past week, more evidence that the correction is over comes from the fact that the August crash hit the price targets projected by the Three Peaks Domed House patterns I labeled here.
The Middle Section also predicts that the time from Point AA to JJ will equal the time from Point E to Point AA. In our case, that implies a 16-month rally. Assuming the 16 months began in August, a top is forecast for December 2016.
There is substantial evidence that the top in late-2016 or early-2017 would be the end of this bull market. The AA-JJ rally on the Middle Section would correspond to a fifth wave on my Elliott Wave count from the 2008-09 lows, completing the bull market.
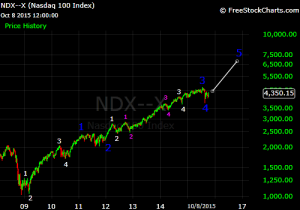
I have been using the NASDAQ-100 (NDX) for my Elliott Wave count as I think it shows the clearest pattern (Primary Waves are labeled in blue):
What are price targets for Primary 5? Any estimates are ballpark, but we could look for a relationship between Wave 5 and Wave 1. Primary 1 (Nov. 2008 – Feb. 2011) carried the NDX up 117%, over a period of 27 months. If Primary 5 lasts for 16 months, that would be a duration of 0.59 X Wave 1, which would give a percentage gain of 69%. That implies a bull market high of 6,400 on the NDX.
For the Dow, I think the bull market began in March 2009. If I apply the same methodology as I did with the NDX but use point gains instead of percentage gains, I get a target of about 20,000 on the Dow. If I use percentage gains, I get a target of about 26,000 on the Dow.
The NDX has risen so much during this bull market that I think percentage analysis is more appropriate than point analysis. However, point-based relationships might still be valid on the Dow.
But, regarding long-term outlook, there is an alternative situation that I should mention. I think there is a 33% chance that Primary 5 will turn out to be an extended fifth wave. The idea behind an extended wave is that the subwaves have the same duration and magnitude as primary waves. Thus, what you get is a bull market with essentially nine primary waves instead of five primary waves. Why do I think there could be an extended wave? There are two reasons.
The first is that popular sentiment regarding the economy and stock market has been strongly bearish throughout this bull market. Normally, by the end of Primary 3, the general public would be warming up to the market again. But my observations show only slight improvement in public sentiment since 2009. Typically, long bull markets (ones lasting > 5 years) end when the general population is very enthusiastic about the stock market and the economy. But I don’t see that happening any time soon.
The comments sections of media articles are loaded with comments denying that there is any economic recovery at all. It’s not just skepticism of headline numbers; many commenters even reject alternative statistics such as the more comprehensive U6 unemployment rate which also shows unemployment coming down. Opinion polls listed on Real Clear Politics show that nearly 66% of the population thinks the U.S. is headed in the wrong direction. Donald Trump, who would not be given any chance to win by conventional political analysis, is at the top of the Republican primary polls. This shows that people are deeply unsatisfied with the country’s status quo and want major changes in leadership.
The second reason I see a chance of an extended wave is that, we have not gotten a single interest rate hike from the Fed even though it has been six years since the economy bottomed out. Now, I do not subscribe to the idea that the Fed controls the stock market through monetary policy. Instead, I think that the Fed’s monetary policy affects economic expectations, which in turn affects earnings expectations, which in turn affects stock prices. However, if monetary policy fails to make a big difference on economic outlook (as was the case in early-mid 2008), the chain reaction stops.
Anyhow, in the present market cycle, if inflation stays low and the Fed does not hike rates sharply in the coming years, any recession in the near future is likely to be relatively mild, and with public sentiment already being bearish, a mild economic contraction might not derail the longer term bull market.
If this is an extended bull market, it would probably last until the mid-2020s. I know that sounds wildly optimistic, and I myself share that feeling, which is why I have only given the scenario a 33% chance. But it’s something to keep in mind given the current situation.


One thought on “Long Term Outlook for the U.S. Stock Market (10-09-2015)”