This week, the NASDAQ-100 has been down as much as 804 points from the all-time high. Previously, the biggest drop during the rally from the October low was 722 points. The rhythm of the rally has thus been broken, suggesting that a correction is underway.
At the October low, an extended Wave-5 of Intermediate degree began. The current drop is Wave-2 within the extended Wave-5. I expect this correction to retrace roughly half of the rally since the October low. Such a drop would end around 16,261, and would be a 12% drop from the all-time high.
The persistent rally in the NASDAQ-100 (NDX) since the October 2023 low makes it appear that the index is in an extended fifth wave. Thus far, the largest drop since the October 2023 low has been 722 points (during Feb 12 – Feb 21). Whenever the index has a drop bigger than that, it will suggest that the index is going to retrace maybe half of the rally from the October 2023 low before the rally resumes.
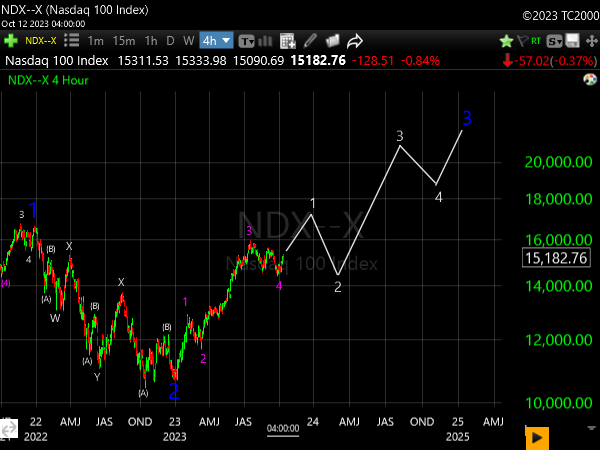
I am changing the labelling of the waves since the December 2022 low from Minor degree to Intermediate degree. This is to allow Primary Wave-3 of the bull market to end in late-2024 or early-2025, which is when I expect an important top due to Lindsay cycles.
A Lindsay Basic Advance began in July 2022 (per Dow Transports) or October 2022 (per Dow Industrials), and a Basic Advance typically lasts for 2.0 – 2.5 years. The market can rally to a moderate new high even after a Basic Advance has ended. I expect that the top in late-2024 or early-2025 will not be the absolute high of the bull market from 2020. Rather, an Elliott Primary Wave-5 should take the major U.S. indices to a final high in 2025 even while a Lindsay Basic Decline is underway.
The NDX made new highs in January, which I did not expect, but now the index is pulling back again. The sign that a correction has begun would be if this drop exceeds the size of the largest drop since the October low, which was the Dec 28 – Jan 5 drop of 720 points. A drop of that magnitude would take the NDX to 16,945.
In my previous post, my upside target for the NDX was 16,968, and the index reached a high of 16,969 on Dec 28. Since then, the index has been pulling back, with a large drop after New Year’s Day.
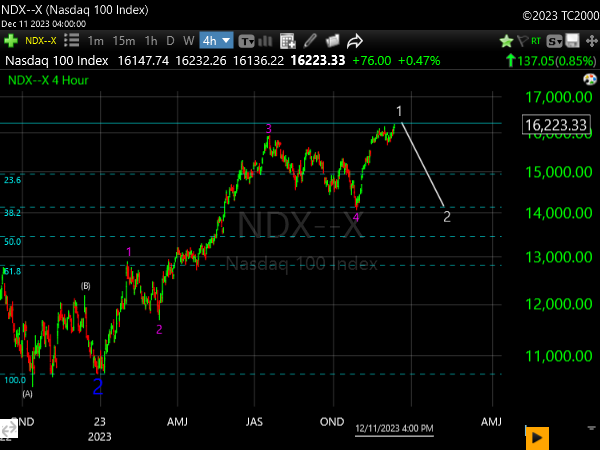
The NDX is in an Intermediate Wave-2 correction, and I expect it to retrace 38.2% to 50.0% of the rally from Dec 2022 – Dec 2023. The Fibonacci retracement levels are shown on the chart above. Most likely, the bottom will be in the vicinity of the Oct 2023 low at 14,058. That would be a 17% drop from the all-time high.
The market has risen faster than what I anticipated. From an Elliott Wave standpoint, my new upside target for the NDX is 16,968, at which point Minor Wave-5 would equal Minor Wave-1 on a percentage basis.
Even though the Dow and NDX have rallied to new highs, I think that a topping process is underway, and that the indices are on the verge of a correction as described in the previous post. The indices may move sideways or creep higher through the end of this year, but I anticipate a thud in January as we have seen in many previous years (e.g. 2010, 2014, 2015, 2016, 2018, 2022).
But by the end of the winter, a powerful rally should take off and last about 6 months.
The Dow recently hit the upper trendline that had been my upside target since the October low. The index has been retreating from the trendline, and I suspect that the Dow may have just entered an Intermediate Wave-2 decline. The Fibonacci retracement levels of the advance from Oct 2022 are shown on the chart. I suspect that either the 50.0% or 61.8% level will be the bottom of the correction.
On the NASDAQ-100 (NDX):
There is a five-wave pattern from the Dec 2022 low to the recent high. Minor Wave-5 (14058 – 16166) is only about 100 points short of Minor Wave-1 (10671 – 12880). Thus, I think there’s a greater than 50% chance that an Intermediate Wave-2 correction has begun. The Fibonacci retracement levels for the advance from Dec 2022 are shown on the chart. I expect the bottom to occur at either the 38.2% or 50.0% retracement level.
I expect the current rally to continue (albeit in a decelerating fashion) until the Dow reaches the upper trendline shown on the chart above (likely early next year). Afterward, I expect a sharp break that will likely turn into the biggest correction since the October 2022 low.
I have a similar Elliott Wave count and projection on the NDX, as shown below:
Looking out longer-term, the Lindsay Basic Advance that began in July 2022 (per Dow Transports) should continue until Fall 2024 or very-early 2025, and the Elliott Wave bull market that began in March 2020 (all major indices) should continue until sometime later in 2025, or 2026.
The chart below has notes on my Lindsay count, including how I expect it to jive with my Elliott count:
He’s been pretty loud here lately, but he’s scared about as many people as he can.
If the Sep 27 and Oct 6 lows on the S&P/NDX and Dow, respectively, end up failing, the bottom of the drop from the July highs is nevertheless imminent.
It appears that the pullback from the July highs has ended. The market should rally through the end of this year to form Minor Wave-5 within Intermediate Wave-1.
Bull markets climb walls of worry. People with a bearish outlook could ask a hundred different “haven’t you seen this/that?” questions, but at the end of the day, the market priced in a meaningful recession during 2022, and unless the bears can convince investors at large that something specific is going to cause a moderate-to-severe recession, the market outlook remains bullish.