The NASDAQ-100 overtook it’s October 2018 high last week. Given that the retracement of the Q4 2018 crash occurred without any major pullback along the way, it would normally signal that a new bull market phase is underway. However, in our present scenario, it is very difficult to find an Elliott Wave count from 2009 – present on any of the major indices that does not show five complete primary waves by 2018.
The U.S. stock market rally since late-December is likely driven by two factors:
- The level of fear in the market and financial media during late-2018 was extreme compared to the economic reality. The disconnect between sentiment and reality was probably the most extreme since the 1998 crash. Thus, anything less than an outright recession should have been enough to trigger a rally in early 2019. So the fact that economic growth ended up fairly normal-looking during Q1 2019 likely resulted in the market’s continuous rise.
2. The Federal Reserve signaled that it is not likely to raise the Fed Funds Interest Rate this year. As long as the Fed keeps the rate unchanged, there is little reason for the stock market to go down. Rate hikes would spook the market as happened last year, but rate cuts would indicate serious growth concerns and would also be bearish for the stock market.
Thus, if the status quo with the economy and interest rates is maintained, the market is likely to continue rising. But that is a big “if.” The market is not completely out of the woods yet. There is also a precedent for a bear market in which after a decline similar to last year’s, the market rallied to a new high without much resistance and then crashed to a new low. This occurred during 1960-1962, as shown below:
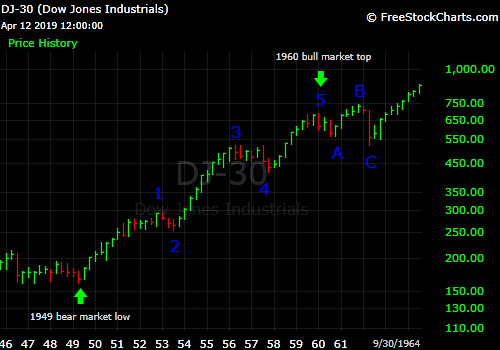
After a 3-year bear market ended in 1949, the Dow embarked on an 11-year bull market from 1949 – 1960, with a clear subdivision of five waves. The Dow’s percentage gain for the 1949-1960 bull market (329%) was very similar to the gains of 2009 – 2018 (317%).
The 1949-1960 bull market was followed by a relatively mild bear market during 1960-1962. The bear market began with an 18% drop in 1960. This was followed by a strong rally (without a pronounced drop along the way) that went 7.7% above the 1960 top by late-1961. But what followed was a 29% drop into mid-1962 to complete the bear market.
In our present situation, the Dow fell 19% during Q4 2018 (similar to the initial decline of 18% in 1960). The current rally on the Dow could go as high as 29,026 without breaking the precedent.
The 1960-62 bear market is the only bear market I have identified which had a rally similar to the current one. Since this is just one case from almost 60 years ago, I would not base a market forecast entirely on this precedent. However, the 1960-62 scenario is enough reason to say that, until the Dow and NDX get at least 8% above their 2018 highs, the rally could get easily erased if macroeconomic factors do not remain in its favor.
On the other hand, if the market does get over 8% above its 2018 highs, even a mild recession is not likely to trigger a drop bigger than 20%.

