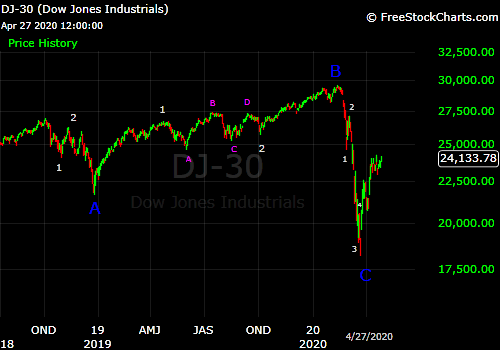
Since my last update on April 7, the Dow has basically been sideways while the S&P 500 and NASDAQ indices have chopped higher. Meanwhile, the COVID-19 infection rate in the United States appears to have also gone sideways over the same timeframe (based on official case counts). However, as I will explain in this post, I think the actual COVID-19 activity in the U.S. has been declining since late-March.
Below is the graph of the official daily case counts from Worldometers as of 4-27-20:

The chart above suggests that the virus activity flattened starting Apr 4, hit a new peak on Apr 24, and has since declined.
Why do I think the virus has actually been in decline since late-March?
Below is the CDC’s graph of Influenza-like Illness (ILI) among outpatients for Week 16 (ending Apr 18):
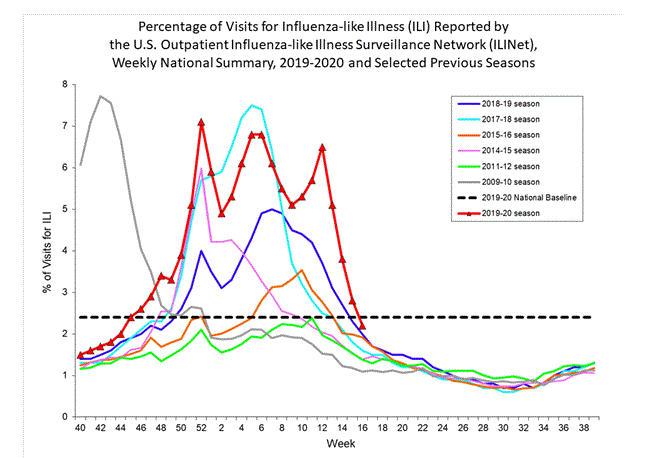
ILI is defined as fever greater than 100 degrees F with either a cough or sore throat, without a known cause other than influenza. This definition is broad enough to include COVID-19, but generally not common colds such as rhinovirus. Somebody who actually tested positive for COVID-19 would not be included in this data. However, someone who presented symptoms but was not tested, would likely be included.
There are several significant aspects to this graph (red line is the current season). First is that after the flu season initially peaked in late-December, there were two lower peaks later (one in early-Feb and another in mid-late March). The peak in early-Feb was probably driven by a flu strain different from the one in December. But the peak in March was probably driven by COVID-19.
The actual flu virus was pretty much gone by Week 13 (ending March 28), as shown in the table of positive tests reported to the CDC. By that time, the percent of respiratory samples testing positive for the flu was only 2.17% (down from a peak of 30.41%). This represented a 93% decline in flu activity, but during that same week, ILI was at 5.1%, which is within the range where moderate flu seasons typically peak.
Since the week ending March 28, ILI has fallen each week. With the actual flu hardly present since then, the conclusion I draw is that COVID-19 has been declining since late-March. The reason this decline cannot be seen in the official case counts is probably due to the limited testing in the U.S. There is essentially a screening process that symptomatic patients have to go through before they can get tested, but the criteria to allow testing have broadened somewhat over the past month. The likely result is that the infection rate has gone sideways (instead of declining) in April because even though the virus is likely in decline, more cases are progressively being discovered (including some asymptomatic ones) that previously would not have been discovered.
Now, getting back to the economy and the stock market, what does all of this mean? Regarding the economic outlook for the rest of this year, it makes a dramatic difference which graph represents the actual infection curve of COVID-19.
If the trend from the official case count is correct, it suggests that the virus’s decline will be slow, and thus the economic recovery will be slow, unless there is a major breakthrough in the prevalence of testing or a treatment is discovered to significantly reduce the severity of the virus. Basically, this scenario drives the predictions that the economy and public activity will be significantly hindered until there is a vaccine next year.
However, if the ILI graph represents COVID-19 from March-onward (which I consider likely), the outlook becomes much more positive. ILI has fallen faster than during a typical flu season (probably due to social distancing). Typically, the flu peaks in February and is pretty much gone by June, four months later. With the speed that ILI has fallen since late-March, I suspect that it will be minimal by late-June (and thus COVID-19 minimal by that time).
Under this scenario, I expect that by mid-July, the virus activity will be so low that whatever testing capacity we have will be sufficient to track and contain the virus while allowing public life and the economy to rebound faster than many are predicting.
I think the stock market has anticipated this ever since the March bottom. The market has been soundly scolded by many commentators for rallying amid the economic distress, but the stock market’s turning points are typically well ahead of the economy. The stock market was falling before the shutdowns and associated economic downturn. Clearly, investors saw this coming based on how reported cases were rising in the U.S. starting from late-February. But then once all the stay-home orders were in place by late-March, I think investors realized that ultimately this would result in a rapid decline for the virus, and the economic damage was priced in by that point.
However, I think the stock market will have a significant correction, somewhere during the May-June timeframe, but it should bottom well above the March low. I intend to make a post later this week, comparing the present situation to 2009, explaining this in more detail.