We Have Probably Seen a Bottom (3/26/2020)

Dow 3-26-20

We may still be in a secular bear market, as will be discussed later, but for now, I think we have seen a bottom.

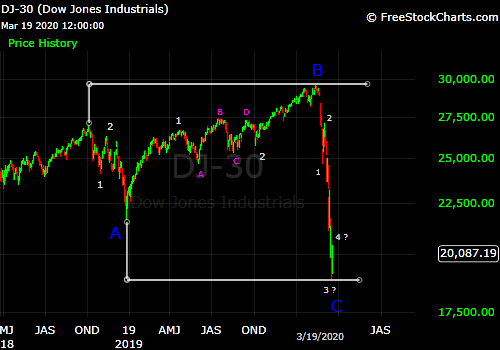
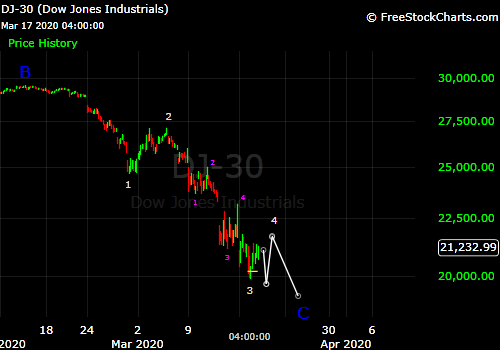
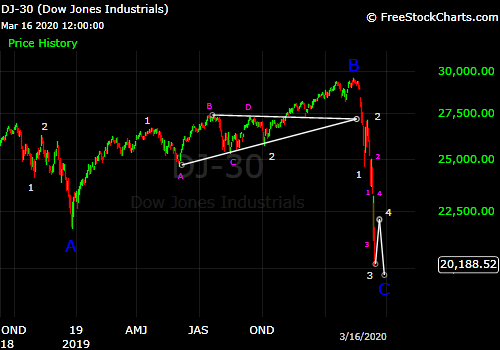
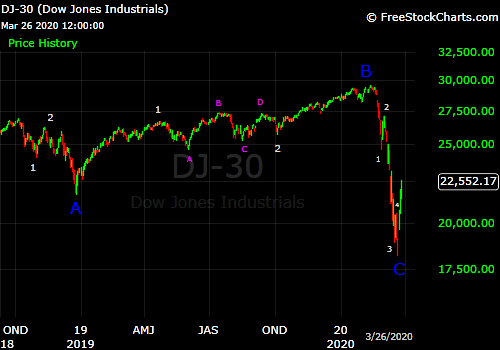
The rally from the 3/23 low on the Dow Industrials is over twice as large as the rally during 2/28 – 3/4. After faltering around the .382 Fibonacci retracement level of the 3/4 – 3/23 crash during the 3/25 trading session, the Dow surged above that level on 3/26 and established itself above that level. Given that it is possible to find five waves down from the 2/12 high to the 3/23 low as shown on the chart, and the current rally seems rather disproportionate to the rest of the C wave, I am in favor of saying that the crash low is behind us.

A retest of the low is very possible, but it should form a higher low even if just marginally.

At the low on 3/23, the Dow was down 38% from the most recent record high. Compare that to the stock market drops associated with the five most recent recessions:

2007-09: 54%

2001: 39%

1990-91: 22%

1981-82: 25%

1980: 21%

Average of last five recessions: 32%

Median of last five recessions: 25%

So, the recent 38% drop on the Dow should be sufficient to price in a recession. One could argue, however, that because the market drop began only 1.5 months ago, and it is still unclear how long and deep the economic contraction will be, there is still too much uncertainty about the future for the market to form a bottom. I would agree with that, were it not for the fact that a broader bear market pattern appears to have begun in 2018. Basically, from October 2018 onward, the prospect of a coming recession was weighing on investors’ minds and the market activity reflected that. Thus, at the Feb 2020 top, the degree of bullish sentiment that would have to be eroded in order to form a bottom amid the crisis we are in now was not as great as you would normally have at a major market top. Consequently, the bottom would be able to come sooner than usual.

This brings us to the next point, what is the long term outlook for the stock market now? Looking at my Elliott Wave count from 2018:

Dow 3-26-20

We have what appears to be a complete Elliott Wave expanded flat pattern from Oct 2018 to March 2020. That is a duration of only 17 months. Over the past century, the shortest period of time that I have classified as “bear market” was 29 months (1960-62). Thus, we may still be in a secular bear market. If that is the case, the Dow would likely rally to a point in between the tops of Oct 2018 and Feb 2020, then go into an Elliott Wave zigzag or triangle pattern lasting another 1-2 years, but would remain within or near the general range established during Oct 2018-present. Then the whole bear market pattern would form an Elliott Wave Combination.

Whether the secular bear market continues will probably be determined by the strength of the economy following the rebound from the current contraction.

Final Drop Likely Still Ahead (3/25/2020)

Dow 3-25-20

During Wednesday’s session, the Dow rose above the Fibonacci target of 21,608 that I discussed in the previous post. However, there was a sharp fade into the close. I still think that most likely there will be a final drop to make a marginal new low before this C wave is over. While this rally is impressive (and has, in my estimation, greatly reduced the odds of the market crashing all the way to the 2016 lows at Dow 15,000), it has only lasted for two days (or three if you count the intraday low on Monday), which means it is still shorter in duration than the rally during 2/28 – 3/4.

Also, while I don’t think that a peak in COVID-19 infections is a prerequisite for a market bottom, I would be very cautious about calling a bottom prior to the peak in the U.S. epidemic when the stock market does not have a clear five-wave pattern down from the highs yet.

Update (3/25/2020 Pre-Market)

Dow 3-25-20

I think the rally from Monday’s low to Tuesday’s high on the Dow Industrials was very significant. Most importantly, it broke out above the trading range that was established during 3/18 – 3/20. This suggests that the rally from Monday’s low is on a wave degree greater than any previous rallies since the interim top on 3/4. Also, this rally is comparable on a point basis and greater on a percentage basis when compared to the 2/28 – 3/4 rally.

For now, from an Elliott Wave perspective, I am counting this rally as Wave IV within C. Thus, I find it likely that there will be one more drop to a new low before this C wave is over. What could change my mind about this though, is if the Dow rises above 21,608, which represents the .384 Fibonacci retracement level of the drop during 3/4 – 3/23.

Next Few Days Are Critical (3/24/2020 Pre-Market)

The futures suggest that the U.S. stock market will open positive. I see three possible scenarios:

A. The market has a strong rally lasting several days. This may indicate that the market has bottomed.

B. The market has a weak rally lasting several days. This may indicate that the market will bottom after falling to a new low.

C. Any rally is quickly reversed within a day or two and downside resumes. This would raise the possibility that the market will continue to fall until either the Dow hits 15,000, or signs emerge that the rate of increase in COVID-19 infections is slowing down.

Is Wave V Underway? (3-23-2020 Pre-Market)

Dow 3-22-20

Above is an hourly chart of the Dow since the February top with a possible Elliott Wave count. The rally from the 3/18 low to the 3/20 high was the longest low-to-high rally since 2/28 – 3/4. The recent rally was not, however, the longest period stabilization since the drop from 3/4.

The futures are suggesting that a new low will be hit on Monday. While it is possible that last week’s rally constituted Wave IV within C, I can’t say with high confidence that it was. After the market drops to a new low, the real key will be to see what the subsequent rally looks like. Once this C wave is over, I expect a very sharp rally lasting several days with only mild interruptions.

If we drop to a new low and only get a choppy rally to follow, then that rally is more likely to be Wave IV within C, with Wave V yet to come.

The magnitude of this crash is straining the long-term expanded flat count on the Dow shown in previous posts. If, in fact, Wave IV with C has not happened yet, I am concerned that we might be headed all the way to the 2016 lows around 15,000.

Update (3-19-2020)

Dow 3-19-20

It was a positive sign that the Dow reversed an early decline on Thursday and Wednesday’s low at 18,917 was not breached. As I type this, the futures are pointing to a loss of 172 points at Friday’s open. If the market goes down on Friday, but Wednesday’s low holds and we rally above Thursday’s high early next week, it would be a positive sign for the intermediate term even if a new low is made first.

The chart above shows my Elliott Wave expanded flat count from 2018. The lines indicate the distance between the Oct 2018 top and the Feb 2020 top, and the distance between the Dec 2018 low and the most recent low. As you can see, the distance between the lows is visibly greater than the distance between the tops on a log scale. Given the extreme circumstances driving this current crash, I am not surprised that it has gone well below Wave A, but if there is much more downside, I would be concerned about the proportionality of the pattern. When it looked like another massive decline was coming on Thursday, that is what had me concerned.

Given the depth of the crash thus far, if this expanded flat pattern is still playing out, Wave V within C could possibly end up being truncated and fail to make a new low. In any case, if the current rally can get above Thursday’s top, I would be fairly confident that this expanded flat pattern is still underway. Right now, I just really want to see some sort of sustained rally.

Not Sure if Market is Still Near Bottom (3/19/2020 Pre-Market)

While I expected that the market may fall to a new low on Wednesday, it was a lot worse than I thought it would be, and now the futures are pointing to steep losses again on Thursday. I am concerned that we have not had any sort of sustained rally since 2/28 – 3/4, despite being well below the 2018 lows on the Dow. I am starting to think we may not see a bottom until either obvious signs emerge that efforts to control the spread of COVID-19 are working, or the major market indices end up down 50% from the highs.

The S&P 500 has just broken below its 2018 low, so perhaps that could lead to a sustained rally, but I’m not making any calls right now.

Update (3/17/2020)

Dow 3-17-20

As I expected, the Dow rallied on Tuesday, but as I type this, the futures are projecting a steep drop at Wednesday’s open. If Monday’s intraday low is broken on Wednesday, I still think we are in Wave IV within C, but Wave IV would likely be taking the form of an expanded flat. If a new low is made on Wednesday, it would likely be followed by a rally above Monday’s top at 21,768. This scenario is shown on the chart above.

I think there is a reasonable chance that this Wave C crash could bottom out next week.

Interim Bottom Likely Reached (3/16/2020)

Dow 3-16-20

Above is my Elliott Wave count and projection for the Dow Industrials, showing the expanded flat that began in 2018. I think that Monday’s low was the bottom of Wave III within C. Regardless of what happens with COVID-19 in the coming weeks, the most likely scenario I see from here for the market is that we get a multiday rally to carry the Dow up 2,000 points or so, followed by a drop to a new low to complete Wave C.

Update (3-15-2020)

Dow 3-15-20

I mentioned last week that I was expecting a rally of about 2,000 points on the Dow Industrials, and then a subsequent drop to new lows to end the crash from the Feb highs. We got a rally of almost 2,000 points on Friday, but looking at the futures tonight, it appears that the market will get slammed at the open on Monday. If the 3/12 low was the bottom of Wave III within Wave C, I would expect the subsequent Wave IV rally to last longer than a single trading session. If the Dow rallies above Friday’s top before making a new low, then I would say that we are in Wave IV. Otherwise, we are still in Wave III.