Long-Term Update (10/29/2020)

I have a bear market count on the Dow Industrials and a bull market count on the NASDAQ indices.

Let’s look at the Dow first:

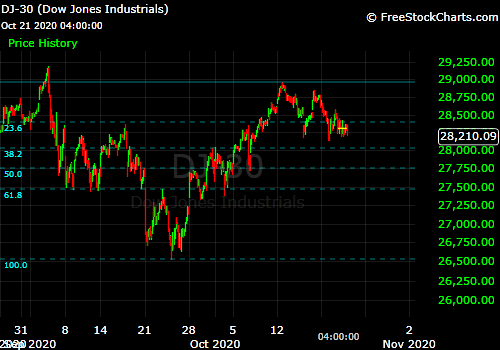
After failing to take out the Sep 3 high, the Dow has now fallen below the Sep 24 low. The ongoing drop from Sep 3 is clearly the most significant bearish phase since the March low.

From an Elliott Wave standpoint, the problem for the bulls is that there is no five-wave pattern from the March low to the September high. Instead, we appear to have a double zigzag as labelled on the chart above, which implies that the entire rally from March to September is a corrective phase within an overarching bearish pattern.

The potential overarching bear pattern is labelled on the chart below:

We may still be in an Elliott Wave double three that started back in 2018. Within this pattern, the first bearish phase was an expanded flat from October 2018 to March 2020. Then we had the separating rally from March 2020 to September 2020. The second bearish phase would be either a zigzag or triangle, likely ending sometime during 2021-22. However, even in this bear market scenario, I think the March 2020 low is unlikely to be taken out.

In contrast to the Dow, the NASDAQ-100 and NASDAQ Composite have patterns from March to the present that are consistent with a bull market. The NASDAQ-100 (NDX) is shown below:

Unlike the Dow, the NDX has five waves (labelled in white) from the March low to the September top. In this bull market count, I think the rally from March to September is Primary Wave I, and the current correction is Primary Wave II.

The NDX is still well above the September low. It is possible that Primary II ended at the September low and that the current drop is just a pullback within Primary III. But given the downward acceleration this week, I am inclined to think that the NDX is headed below the September low.

The Fibonacci retracement levels of the entire rally from March to September are shown above. Possible bottom targets for the current correction would be the 38.2%, 50%, and 61.8% levels.

This wave count on the NDX could still be very bearish short-term. The 61.8% retracement level is about 20% below where the index is now. But once this drop is over, a very powerful Primary III rally should take off.

I do not have a firm opinion right now as to whether the Dow or the NDX is leading the broader stock market. I think the key will be to wait and see if the NDX rallies above the September top. If it does, I would say that the NDX is driving and we’re in a bull market. But until that happens, the Dow is a cause of concern.

Update (10/28/2020 Pre-Market)

The U.S. indices had a sharp drop on Monday that took the Dow just slightly below the 61.8% Fibonacci retracement level of the rally from the Sep 24 low to the Oct 12 high. The Dow got a 300 point intraday bounce late in Monday’s session, but failed to continue the rally on Tuesday.

The S&P and NDX have not reached 61.8% Fib. yet, which makes me think we could have one more woosh down to make that happen.

If 61.8% Fib. were to clearly fail on all three indices, I would have to say that this drop is bigger than what would be expected if my longer-term bullish view remains correct. But in an environment of high market volatility and panic sentiment in the media like we have now, I tend to think that it is better to look at the big picture and not read too much into every market swing.

Nevertheless, the September lows are where I draw the line. A drop below there on either the Dow or S&P would suggest a return to the bear market from 2018.

Choppy Decline (10/25/2020)

Notice that the drop from the Oct 12 high has been significantly shallower and choppier than the drop from the Sep 3 high. I take this as a sign that the drop from Oct 12 is just a corrective wave within the rally from the Sep 24 low.

On Thursday, Oct 22, the Dow rallied off the 38.2% Fibonacci retracement level of the advance from Sep 24 to Oct 12. I don’t know if we have seen the bottom of this drop yet, but I still think it is unlikely to exceed the 61.8% retracement level at 27,461.

Update (10/22/2020 Pre-Market)

The major U.S. stock market indices have been trending downward since Oct 12. I think this drop is “fear of fear” regarding the election, rather than fear of the election outcome itself.

The charts above of the Dow, S&P, and NDX show the Fibonacci retracement levels of the rally from Sep 24 – Oct 12 (Dow, S&P) and Sep 21 – Oct 12 (NDX). I do not think this drop will exceed the 61.8% levels. Those levels would be 27,461 on the Dow, 3,338 on the S&P, and 11,260 on the NDX.

If the indices were to exceed 61.8% retracement, I would not have high confidence that the September lows would hold, and a breach of the September lows may indicate a bear market.

But for now, I think this is a short-term pullback that will be followed by a strong rally through the end of the year.

The U.S. Stock Market and the 2020 Election (10/12/2020)

Over the past four years, the stock market has alternated between anxiety and enthusiasm over Trump. In the weeks leading up to the 2016 election, the S&P 500 fell about 4% as Trump climbed in the polls. However, the market embarked on a powerful rally starting the day after the election. For over a year after the election, no interim drop on the S&P or Dow exceeded 5%.

I think the pre-election drop was “fear of fear” that Trump would win and start a trade war, whereas the post-election rally was discounting a boost to corporate profits from tax cuts. Major tax reform was signed into law by Trump in December 2017, which included a significant reduction in the corporate income tax rate from 35% to 21%.

But soon afterward, the stock market got more turbulent. The stimulative effect of the tax cuts had been largely discounted, and the market became anxious in 2018 as Trump imposed tariffs on imports and from China and prompted a trade war.

The major stock indices were cyclically vulnerable to a bear market in 2018. I consider a bear market to have begun in October 2018 and continued all the way to the coronavirus low in March 2020. Though the timing could have been different, this bear market was likely to happen even with no trade war and no pandemic. But within the bear market, downward moves were often prompted by tariff announcements.

For the upcoming election, I don’t know what the short-term market reaction would be to either Trump or Biden winning. But the bigger picture is that stocks are in a bull market that should last until 2024-25, as I wrote about here. Even if Trump were to engage in more trade battles, it would not derail the bull market. Nor would anything realistic from Biden and the Democrats in Congress.

Setting aside what the market thinks of either candidate, the rally since March, and especially since June, is telling us that the market has a view of the near future that is very different than what the mainstream media is telling us. If the mainstream media’s experts are right and public life doesn’t shift toward normalcy until the second half of 2021 (or 2022, or 2023, or who knows when), there is no reason for the market to be rallying now. Basically, if those prognosticators are right, stocks should have returned to a bear market in June. I was writing back in June, in the wake of the sudden market plunge, that a return to a bear market was possible, but the market recovered.

The market sees things turning around much sooner than the media is suggesting. I think that the media’s narrative on COVID is connected to their narratives on other issues in the news this year. It is hard for me to picture anyone who holds the sentiments provoked by the mainstream media voting for Trump.

On one hand, around any major economic turning point, the stock market changes its tune long before the media and public sentiment change their tune. But in this current environment, with skepticism toward the media higher than probably any other time in modern American history, I would not be surprised if the stock market rally turns out to be a sign that contrarian sentiments are quietly spreading through the population in a way that will result in Trump being reelected.

Long-Term Perspective (10/5/2020 Pre-Market)

Above is a chart of the Dow Industrials with my Elliott Wave count from the March 23 low. I think we are still in Primary Wave I of this bull market. Within the first Primary wave, I consider Intermediate Wave I to be the rally from March 23 – April 29. That rally clearly subdivided into five waves of Minor degree (labelled in magenta).

From the April 29 top, there was a clear zigzag drop to a low on May 14, which was the Intermediate Wave II drop.

From May 14, Intermediate Wave III began. This appears to be an extended third wave. Extended third waves are typically at least 1.618 times Wave I. In our case, that would produce an upside target of 33,388 on a point basis, and 36,051 on a percentage basis, likely occurring during the next 6-9 months.

We are entering, even now, what should be a very bullish phase, given that, coming off the Sep 24 low, the Dow entered the third wave of the third wave of the extended third wave.