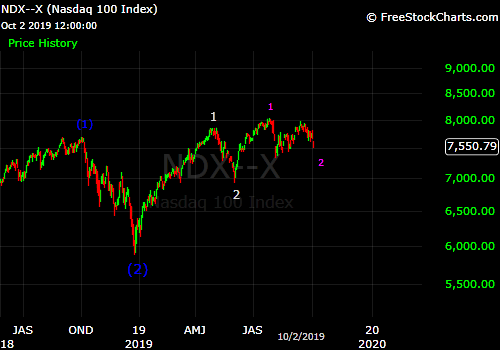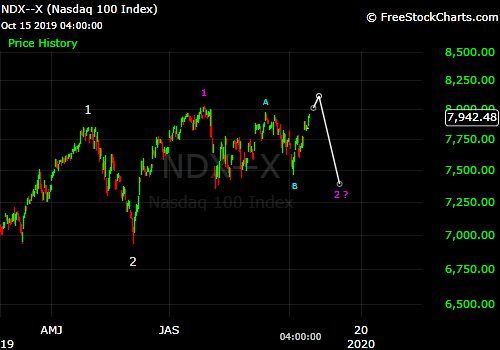
The U.S. stock market has continued to be very reactive to every headline on U.S.-China trade negotiations, economic data, and prospects for Fed rate cuts. This behavior, combined with the failure to either make a new high or a new low since the early-August lows, leads me to think that we are still in a corrective pattern.
Despite the market’s year-to-date gains, there has been a lot of bearishness over the past 12 months. I think that the crash of 2018 priced in a scenario in which economic growth would basically come to a standstill due to the U.S.-China trade war and Fed rate hikes, but the fact that economic growth continued on in a normal rate in Q1 2019 is what enabled the strong rally until late-April. The Apr-June correction priced in a slowdown in growth due to the trade war that initially appeared to be worse than reality (hence the rally into late July, but further economic deceleration in 3Q has sent the market sideways. I expect the market to eventually rally to new highs again as long as a recession does not appear imminent, but first we need to see either substantial progress toward a trade deal, or else anxious investors who are buying and selling on trade news and rumors need to give up on a resolution to end the tariffs in the near future, get the selling done, then get out of the way and let longer term bulls take over again.