As shown on the chart below, the Dow Industrials is not that far away from its June low, and with the aggressiveness of the selling, I think it is time to seriously consider scenarios in which the June lows on the major indices fail.

If the June low of 29,653 fails, the worst-case scenario that I see would be a drop to 27,582 (representing a 50.0% Fibonacci retracement of the rally from March 2020 – January 2022.
For the S&P 500:

The worst-case scenario that I see is a drop to 3,504, representing a 50.0% retracement of the rally from March 2020 – January 2022. This would not be much below the June low of 3,636. I think there is good reason to expect that time spent below the June lows (if any) will be relatively short on the major indices, for reasons described later.
For the NASDAQ-100:

The worst-case scenario is a drop to 10,588, representing a 61.8% Fibonacci retracement of the rally from March 2020 – November 2021. As with the S&P, this does not represent a major break below the June low.
I still do not think that a break below the June lows is the most likely scenario. With the backdrop of an economy that is still experiencing strong employment growth (+315,000 jobs in August), and an S&P 500 that was down 25% from all-time highs as of the June low (enough historically to discount a mild recession), it makes sense to say that the current drop is merely an “Elliott Wave 2” pullback.
However, even if a break below the June low does occur, my reason for thinking it will be relatively short-lived comes from my Lindsay Basic Movements analysis on the Dow Transports (discussed more in the previous post).
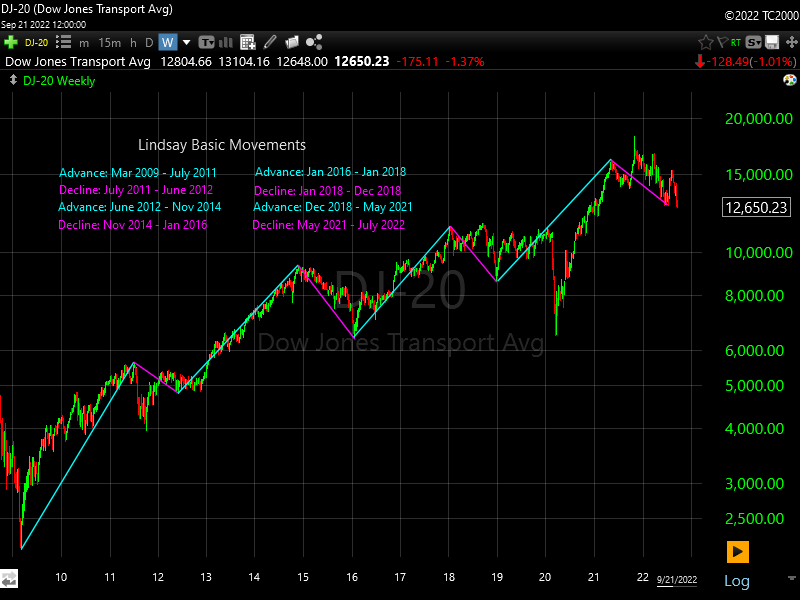
Even though the Transports have broken below the previous correction low (July in this case), I still think that a basic advance began in July. Thus, I would expect additional downside to be relatively short in duration before a rally to all-time highs begins.

